
Transposed from Gaiiden’s Scroll
So I read this article in a recent issue of Game Developer Magazine about this cool logging and reporting system that was developed for Ghost Recon. And I looked at my current logging system and broke down into sobs at the mediocrity of it all. It doesn’t even make use of my cool new messaging system and it outputs to plain ASCII text. Ugh. I thought for a second about implementing some RTF or HTML output to make it look nicer, but I realized that really wasn’t what I needed. I needed a log file interpreter program. I needed to be able to output my log data in the most arcane format possible and then build an app that could read it and display it in various informative ways. Ah haaaaa.
So I opened up Flash and began to conceptualize. I really like to draw out my interfaces first so I can decide what I want and where I want it and how it will work and what else I need and so on and so forth. I finally settled on 4 different visualizations:
Error Text
These are just text error messages that tell you what went wrong or what may have gone wrong or what’s doing what and when and where. Common to every log system.
Messaging
Various charts and data that display how messages are being tossed around during the game in order to spot performance bottlenecks and recursive messaging, among other things
Profiling
Duh. This is a no brainer. Various charts that show how any timed processes have performed throughout the program runtime
FPS
I want this to be not just an overall look at the FPS throughout the game, but also to provide data that could tell you why the FPS has slowed or increased
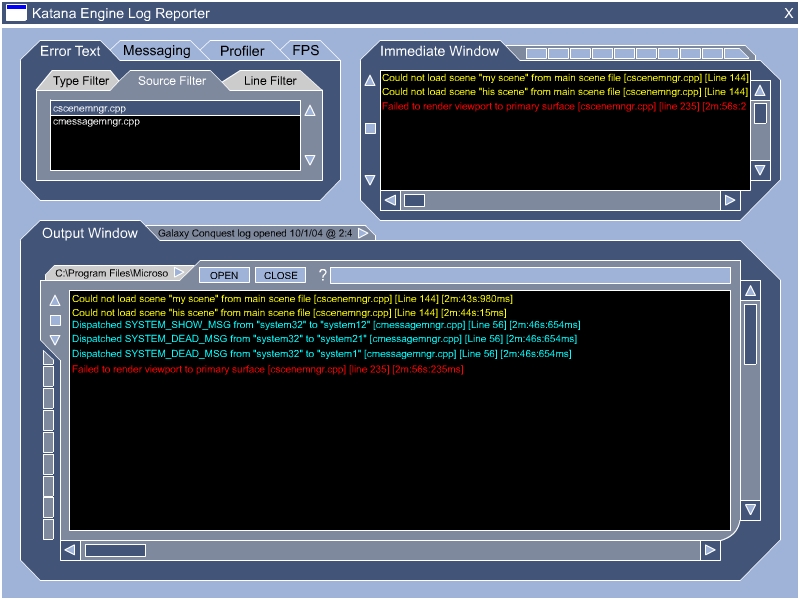
So yea. After I nailed down the overall interface I quick mocked up the Error Text displays. Here’s the first one:

So this is pretty straight forward. The entire log is dumped into the Output Window for perusal. But since the log could be quite frikin huge, if we only want to see a certain type of log message, we can select it from the list and it will appear in the Immediate Window.
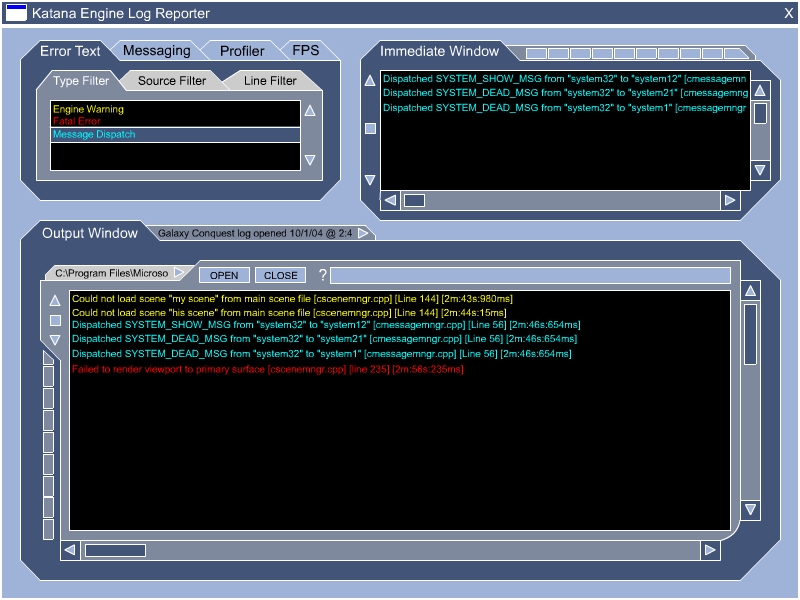
Moving on:
Here we have the same thing, except you can choose from the source file you wish to see. Although I messed up in the mockup, I mean for this to work in conjunction with the Type Filters setting. So if Message Dispatch were still selected, you’d only see message dispatch output from that source file in the Immediate Window.
Finally:
Again, the Line Filter works with the other two filters. So in this case you can choose exactly which lines from the source file(s) you have selected that you want to view. Notice I have both available lines selected. I could choose just one instead.
So yea. I’m going to finish mocking up the Messaging visualizations tomorrow. I started on them but I’m only halfway done right now.
Sobald Ihre Daten bestätigt wurden, erhalten Sie Anweisungen, wie Sie Ihren eindeutigen Benutzernamen erhalten. Es gibt eine sichere Möglichkeit,
Ihren Zodiac Casino-Benutzernamen zurückzubekommen, wenn Sie
sich nicht daran erinnern können. Wenn immer
wieder Probleme auftreten, können Sie Hilfe vom Kundenservice von Brand Name erhalten. Wenn Sie
weiterhin geoblockierende Nachrichten erhalten, starten Sie
Ihr Gerät neu und löschen Sie den lokalen DNS-Cache, um alte Netzwerkeinstellungen zu
entfernen.
Sie können jederzeit auf mehr als 1000 spannende Casinospiele zugreifen. Neue Kunden starten in der Regel mit einem Willkommensbonus
auf die erste Einzahlung, oft kombiniert mit einem Freispiel-Paket für ausgewählte
Slots. Zahlungsinformationen werden nur über zertifizierte Zahlungsdienstleister verarbeitet, und der Zugriff auf Spielerkonten ist durch Passwörter sowie zusätzliche Sicherheitsmassnahmen abgesichert.
References:
https://online-spielhallen.de/888-casino-promo-code-ihr-weg-zu-exklusiven-boni-und-vorteilen/
Als Veteranen des Online-Glücksspiels sind dies die goldenen Regeln, nach denen wir spielen. Stellen Sie einfach sicher, dass der Bonus für Spiele
gültig ist, die Sie spielen möchten. Einige No-Deposit-Boni können auf alle Spiele angewendet werden (oft mit Ausnahme
von Live-Tischspielen), während andere nur für ausgewählte Titel
gültig sind. Feste Bargeldboni haben in der Regel einen maximal erlaubten Einsatz.
Wenn Sie in einem No-Deposit-Bonus-Online-Casino spielen, ist jeder Einsatz, den Sie tätigen, klein. Behalten Sie daher die
festgelegten Grenzen im Auge, wenn Sie Casinobonusgelder in Deutschland beanspruchen.
Bei einigen Seiten müssen Sie jedoch den No-Deposit-Anmeldebonus selbst beanspruchen. Sind Sie sich nicht sicher, wie
Sie echte Geldbonuscodes ohne Einzahlung für Online-Casinos verwenden können?
Daher können Sie bei uns einfache Anmeldeboni ohne Einzahlung mit klaren Bedingungen und großem Wert erwarten. Wenn ein Spieler, der unsere Webseite besucht, auf einen dieser Links klickt und einen Kauf bei unserem Partner tätigt, erhalten wir dafür eine Provision. Die Auszahlung von Bonusgewinnen ist jedoch auf einen vom Casino
vorgegebenen Maximalbetrag beschränkt.
References:
https://online-spielhallen.de/rooli-casino-cashback-ihr-weg-zu-mehr-spielguthaben/
Visit the Cashier for a voucher to be presented to the hotel uponcheck-out.
Use your Vantage Dollars on an electronic gaming machine
by following the screen prompts. Hand your Vantage Rewards card to the
croupier when playing table games.
Insert and play with your Vantage Rewards card into compatible electronic gaming machines.
Explore the many advantages of Vantage Rewards. Currency on compatibleelectronic gaming.
A relaxing overnightstay in our resort. Every time you play, stay and dine with us, you’ll
earn Vantage Points that you can redeem for Vantage Dollars to
use anytime you visit.
References:
https://blackcoin.co/fastest-withdrawal-online-casinos/
Over 500,000 expert-authored dictionary and thesaurus entries Browse related
words to learn more about word associations.
There are still about 200 people working during decommissioning so
it remains an important employer but well short of the numbers it once had.
Examples are provided to illustrate real-world usage of words in context.
In some cases, collection is authorised or required by law, and consent is not required.
Where required, TSEG relies on consent through clear signage and Conditions of Entry.
A synonym for ‘very very important’ is crucial. When it comes to expressing the
importance of something, there are a variety of words
that can be used. “Important” suggests value or significance, while “fundamental” refers to something that is
foundational or basic, It implies that something is foundational or at the core of something else.
It is a critical component, and without it, the whole project or task
would fail. Something that is crucial is essential to the success
or outcome of something.
References:
https://blackcoin.co/king-billy-mobile-casino-app-for-australians-android-ios-guide/
When visiting the site Wolf Winner for the first time, the player will
be immediately struck by the stylish and thoughtful design. Mesmerizing gaming moments, exciting designs and innovative experiences are what
awaits you at Wolf Winner Casino. At the end of
the Wolf Winner Casino review, you can make a decision whether
to plat at the casino for real money and enjoy your online casino journey.
It’s secured with SSL encryption and a host of other security technologies that keep players safe.
The mobile website is made with HTML5 technology for easy mobile access.
We offer a variety of ongoing promotions tailored for our existing players.
Understanding the bonus terms before claiming is crucial, as it helps you make the most of your experience
and avoid any surprises down the line. Wagering conditions apply,
which require you to wager the bonus amount 30 times before you can withdraw any winnings
derived from the bonus. Upon registration and
your first deposit, you can claim a 100% bonus up to $500,
giving you double the fun right from the start. For a complete overview of all available bonuses and promotional offers, including detailed terms
and conditions, visit our comprehensive bonus guide.
References:
https://blackcoin.co/neospin-casino-australia-a-comprehensive-overview/
With an accessible location by car and ferry, and free parking for all
guests. By mixing a baking soda solution, dipping a piece of wool yarn in the jar and running it to another jar, you’ll be able to observe baking soda
particles forming and hardening along the yarn, similar
to how stalactites grow. For this saltwater density experiment, you’ll fill four clear glasses with water, then add salt to one glass, sugar to one glass, and baking soda to one glass, leaving one glass with just water.
While the food is cooking, you can explain to kids how the oven uses the sun’s rays to heat the food.
Get in touch with our friendly team, we’re here
to help.Whether you’re looking to book a table at one of our restaurants, are curious about our room With free parking and fantastic dining options close by, these options are walking distance from Wrest Point tower.
The Wrest Point Tower delivers views you’ll never forget.
Other festivals, including the Southern Roots Festival and
the Falls Festival in Marion Bay, also capitalise on Hobart’s artistic communities.
The city’s music scene has given rise to internationally acclaimed
acts working in a variety of genres, including Striborg
and Psycroptic (metal), The Paradise Motel (chamber pop), Sea
Scouts (noise rock), and Monique Brumby (indie pop).
Another popular live entertainment location is the Hanging Garden precinct, which contains several venues and hosts Dark Mofo and Hobart Festival of Comedy events.
Tenant-oriented housing models may become more common, with a few
examples in Hobart such as 2020’s all-electric The Commons Hobart
where expensive parking mandates were waivered to enable an affordable green lifestyle.
Of the 76,686 total dwellings in urban Greater Hobart in 2021, only 10% were a flat or apartment and 7.2% semi-detached or terrace.
References:
https://blackcoin.co/stay-casino-no-deposit-bonus-australia-free-spins-bonus-codes-2025/
paypal online casinos
References:
chansolburn.com
paypal casino usa
References:
https://page.yadeep.com/melindabab
casino mit paypal
References:
https://saudiuniversityjobs.com/employer/paypal-casino-list-2025-online-casinos-with-paypal/
online casino that accepts paypal
References:
https://chefstaffingsolutions.com/employer/play-paypal-pokies/
online roulette paypal
References:
https://metagap.ro/employer/play-pokies-real-money-with-instant-withdrawal/
casino avec paypal
References:
https://empleosrapidos.com/companies/best-online-casinos-australia-top-aussie-gambling-sites-2025/