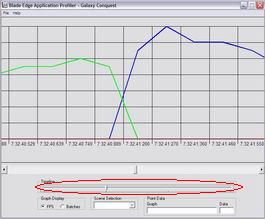
The profiler is not meant to profile an entire application, rather to take a quick snapshot of how the application performs on a certain machine. Because of this, some log files may be too large to display on one graph. If this is the case, then the timline control directly below the graph becomes activated.
You use the timeline control by clicking or clicking and dragging the slider to the tick mark you want to load. The log file starts on the left side of the slider and ends on the right. The graph will reset with the new data and the chosen graph will be maintained, so advancing the timeline when viewing a Batch graph won't default the chart back to an FPS graph.
| Prev: Changing the Graph Display |
Next:
FPS Graph
|