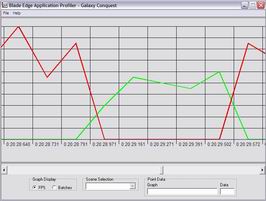
The FPS graph will show you the Frames Per Second for each frame of program execution. The numbers of frames per second are displayed along the left side of the graph, while the program run time is displayed along the bottom. The run time will never begin at 0 because load time is factored in as well. In the case of this graph, higher numbers are better.
The multicolored lines each represent different "scenes" in the application. A scene is the application's idea of a screen. So a menu would be a scene, or the screen where you play the game would be a scene. You can tell when the application switches from one scene to another when the FPS graph lines cross, as shown in the example on the left.
In order to obtain further data from the graph, you can click on a graph line and the nearest point will be selected. The data from that point will be displayed in the text boxes to the lower right. The Graph box will tell you what scene this line represents, and the Data box will display the exact frames per second, since as you scroll you will lose sight of the fps numbers on the graph.
| Prev: Changing the Graph Display |
Next:
Batch Graph
|