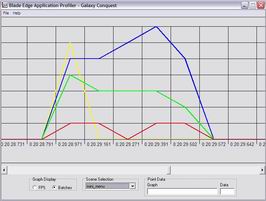
The Batch graph shows you the rendering times for batches of various application objects. When the application renders, it likes to group like objects together so they can be rendered faster. These objects are text, buttons, sprites, and images. Every Batch graph will have four data lines. Like the FPS graph, the application run time is displayed along the bottom, but the rendering time in milliseconds is displayed along the side instead of frames per second. In the case of this graph, lower numbers are better.
This graph only displays data from one scene at a time. In order to change the scene you want to see, use the drop down list box in the lower center to select the proper scene. Each colored line represents the renderig time of a different object. You may have to scroll a bit to get to the graph of scene loaded late in the application's run time.
In order to obtain further data from the graph, you can click on a graph line and the nearest point will be selected. The data from that point will be displayed in the text boxes to the lower right. The Graph box will tell you what object this line represents, and the Data box will display the exact rendering time in milliseconds, since as you scroll you will lose sight of the numbers on the graph.
| Prev: FPS Graph |
Next:
Table of Contents
|